Only one of us (Erkka) was able to attend the third workshop, so the Power/Interest Grid for Stakeholders and Customer Grouping Canvas represent his ideas on these topics. However, we agreed that the pictures will be uploaded as they are and that all of us can then comment on them to explain their own ideas. This way our thought process also becomes visible to the reader, which is a happy consequence of working this way on this particular blog post.
Power/Interest Grid for Stakeholders
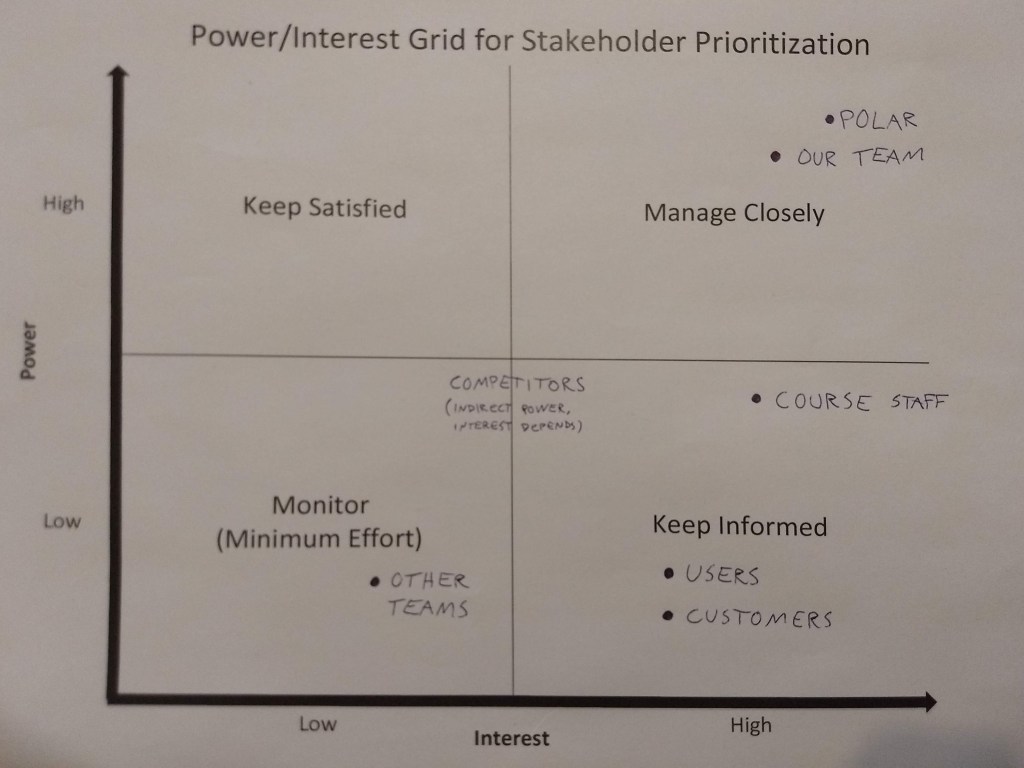
The Power/Interest Grid includes seven different stakeholders. Thinking of their placement in this grid wasn’t as easy as one might at first imagine. Moreover, the position of each depends very much on the phase of the project (planning/executing/product delivered), so the grid is at best a coarse approximation.
Polar, being our “customer”, would have very high power and interest if this were “real” project. In reality, in the case of this course project, their interest may not be that high, and even though they have power, they seem not to be willing to use it that much, but instead have given us quite a lot of freedom to define in which direction to take this project. Naturally, our team also has lots of both power and interest.
Course staff doesn’t have that much power in directing our project, though they may affect it by giving us helpful feedback. However, they are paid to be interested in it, so it is supposed they will be. Our product’s users and customers are predicted to be very interested in our product, though that remains to be seen.
Other teams on this course most probably do not have very much interest in our project, unless we develop something extraordinarily awesome. Nevertheless, during the development process, there won’t be much interest. Same applies to the power of other teams: unless we become aware of some of their ideas, and try to apply them ourselves, they will not have much power, even of the indirect kind.
Placing our (or Polar’s) competitors on the grid was most difficult, so they were set in the middle without a dot denoting their “exact” position. Competitors are important stakeholders, though, so they had to be placed somewhere. Their interest depends very much on our final product and how directly it competes with their products or how likely it is to steal their market share. They don’t have direct power over our project, but at least bigger companies may have significant indirect power that has to be taken into account. In a more detailed grid, noteworthy competitors would be considered individually.
Customer Grouping
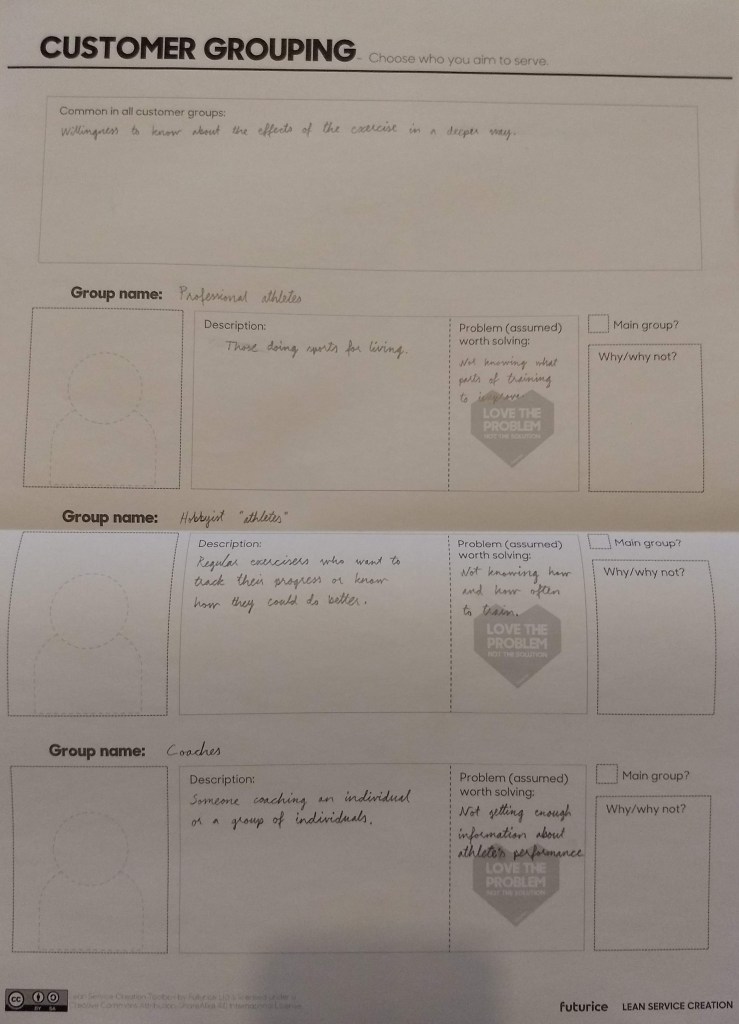
During the workshop three main user groups were identified: professional athletes, hobbyist “athletes” (meaning ordinary peoples who like to do sports), and coaches. Common to all of these groups is willingness or desire to have a deeper understanding of the effects of the exercise.
Professional athletes most probably already know quite a lot about their exercises’ efficiency and may also be better than an average person at listening to their body. Their (assumed) problem is therefore not knowing where to improve, since they are already doing as much as they can to perfect their performance. In addition, professional athletes want exact information about their performance.
Ordinary people who exercise usually have considerably less knowledge about their exercise compared to the professional athletes. They would likely benefit a lot from knowing when it is wise to exercise and when to rest as well as what kind of exercises are most beneficial at any given moment in their training schedule. Their assumed problem is not knowing when and how to train in the most effective way and how to avoid getting injured.
Coaches are comparable to professional athletes in their knowledge of the effects of the exercise. Therefore their problem is similar to the athletes’ one. There’s also the subgroup of coaches who train teams. In their case the performance of the entire team is more important than the performance of its individuals, so their main problem is not knowing how the performance of single athletes translates into the performance of the entire team.
User research
We performed a some intercept interviews both during the workshop and the on-going week. The questions we asked were:
- Do you do sports?
- What kind of sports do you do?
- How would you describe your relationship to technology in general?
- How would you describe your relationship to sport-related technology in particular?
- How often do you exercise?
- Do you use any tracking device when exercising? Why/why not?
- What do you think is the greatest benefit of using such a device?
- Do you find the information given by the device useful?
- What information about your exercise would you like to have?
- In what ways do you keep track of your well-being?
The results are compiled into this file (unfortunately some in Finnish):
The results were quite varying, but gave us a better idea what our potential users. Most of our interviewees were already familiar with sports-related technology, said they did sports at least a few times a week and used some kind of a fitness tracker. They listed heart rate, motivation, progress and general performance as the most useful information given by the devices and wished to have information about stretching, possible routes, heart rate zones for aerobic/anaerobic exercising and recovery.
